





UCLA’s no. 2 public school ranking
a closer look
When the 2026 Best National Universities rankings were published in September 2025 by U.S. News & World Report, Bruins learned that for the first time in nine years, UCLA was no longer considered the No. 1 public university in the nation, falling to the No. 2 spot behind UC Berkeley. The school also slipped from No. 15 to No. 17 in the broader national ranking that includes private universities. To understand these results, we explore how the rankings are determined and what has changed.
U.S. News has been publishing their report since 1983. They use up to 17 factors to measure academic quality and graduate success, including faculty research, student outcomes and financial burden on students. For schools like UCLA that no longer report SAT/ACT scores, the calculation uses 16 factors.
The ratings use self-reported data from universities, which goes through a lengthy review process, as well as data from the U.S. Department of Education’s College Scorecard. “The raw data is first transformed into calculated values, which are then statistically converted to a standardized scale to allow for fair comparisons across different measures.”
“With the U.S. News rankings, one year of movement is not a trend.” Natural fluctuations are an expectation of statistical analysis, and within the top ranked schools, small changes may make a big difference.
UCLA’s Office of Academic Planning and Budget maintains a rankings dashboard that analyzes historical trends and the most prominent rankings. U.S. News provides a supplemental publication called, “How U.S. News Calculated the 2026 Best Colleges Rankings.” In 2023, they reflected changes in higher education by reducing the weight of standardized tests, high school class standing and alumni giving. For the 2026 rankings, their methodology was largely unchanged.
The assessment categories fall into four main areas:
- Student Outcomes (57%) tracks success in preparing students for life after college. It includes:
- graduation rates (21%)
- first-year retention rates (5%)
- performance against a predicted graduation rate (10%)
- low-income student success measured by the Pell grant graduation rate (5.5%)
- Pell graduation performance (5.5%)
- post-graduation federal loan debt (5%)
- earnings five years after graduation (5%)
- Peer Assessment (20%) is a qualitative measure taken from surveys of the presidents, provosts and deans of peer institutions on topics including innovative teaching and institutional health.
- Faculty Resources (19%) measures a school’s commitment to quality instruction:
- student-faculty ratio (3%)
- proportion of instructional faculty employed full-time (2%)
- full-time instructional faculty salaries (6%)
- financial resources (8%) measures per-student spending on academic programs and services.
- Faculty Research (4%) includes four factors from a five-year window (2020-2024) that measure the school’s research impact, including:
- Citations per publication (1.25%)
- Field-Weighted Citation Impact (1.25%)
- Publication share in the top 5% of journals by Elsevier’s CiteScore (1%)
- Publication share in the top 25% of journals by CiteScore (0.5%)
Although UCLA’s overall score declined in the 2026 rankings results, there were some measures that improved from 2025. The University’s six-year graduation rate increased from 92% to 93% and first-year retention rates increased from 96.8% to 97%. This is a positive sign for the University, suggesting that improvements are being made in student support and advising.
There are three main areas where UCLA’s scores dropped, impacting the overall score: the University’s student-faculty ratio, the graduation rate gap among students who receive Pell grants vs. those who don’t, and the peer assessment score.
UCLA’s student-to-faculty ratio accounts for 3% of the total rankings weight. In the past year, this measure increased from 19.3 students to faculty, to 20 students to faculty. If this trend continues, it could potentially lead to larger class sizes and increased competition for personalized feedback. Unlike UCLA, UC Berkeley’s student-to-faculty ratio has decreased from 18.7 to 18.0 during this time.
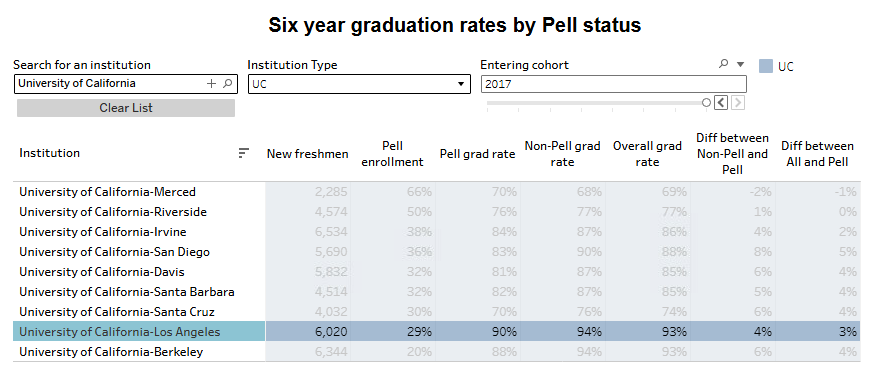
In the measure of social mobility, the gap widened between students who received Pell grants and those who did not, accounting for 5.5% of the total rankings. Nearly 28% of UCLA undergraduates receive federal Pell Grants, unchanged since the previous year. For students who entered the university in 2017, the six-year graduation rate for Pell Grant recipients (90.3%) versus non-Pell Grant recipients (93.9%), is a 3.6% difference. Comparatively, the six-year graduation rate in 2018 was a 4.8% difference (89.3% vs. 94.1%). This gap shows that students from low-income backgrounds who qualify for Pell Grants are not benefiting from the overall improvements in graduation rates as much as their peers who do not qualify. Although UCLA graduated a larger number of Pell Grant recipients in the six-year window, it did not keep pace with the rate of students graduating who were not Pell Grant eligible.
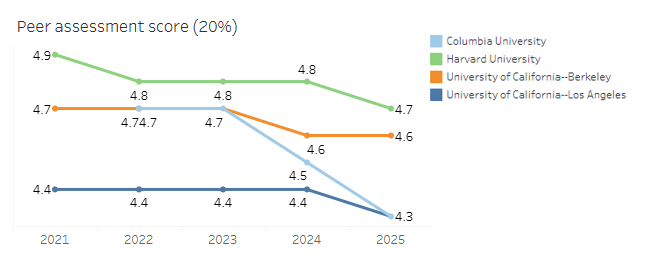
The peer assessment score is a heavily weighted category. It is how the University is regarded by top administrators at other institutions. U.S News collected the most recent data by administering peer assessment surveys to schools in the spring and summer of 2025. Each survey respondent was asked to rate the overall academic quality of peer schools’ undergraduate academic programs on a 5-point scale: outstanding (5), strong (4), good (3), adequate (2) or marginal (1).
The year prior, UCLA drew national and international attention. Many in our community suffered as a result of student, faculty and staff protests, political scrutiny, and the devastating wildfires. We also welcomed a new chancellor to the University. UCLA’s peer assessment score, which accounts for 20% of the total score, fell from 4.4 to 4.3. While UC Berkeley’s peer assessment score remained stable in 2024-25, UCLA’s tenth of a point drop in this may have been the deciding factor in UCLA’s rankings result.
UCLA’s peer assessment score, which accounts for 20% of the total score, fell from 4.4 to 4.3.
Looking forward, UCLA, and universities across the country, are facing unprecedented challenges in light of proposed cuts to federal funding. In addition, U.S. News rankings rely heavily on frameworks from the American Council on Education (ACE) and the Carnegie Foundation for the Advancement of Teaching (Carnegie Foundation). Both organizations have updated their methodology to adapt to the current educational system. These changes are being carefully reviewed and may impact future rankings.
While the drop in rankings may have come as a surprise for Bruins, U.S. News says, “With the U.S. News rankings, one year of movement is not a trend.” Natural fluctuations are an expectation of statistical analysis, and within the top ranked schools, small changes may make a big difference. Additionally, it’s not just how UCLA performs in a given category, but how well it does in comparison to other schools. In other words, even if UCLA posts statistical improvements from year to year, it can still fall behind in the rankings if its peer institutions are also excelling at a slightly higher rate.
Through whatever changes or challenges the future may bring, rest assured UCLA will continue to pursue its mission of research, education and service.
connect articles

Connect Newsletter
The Beat Goes On
Life can be very unpredictable. Such is the story of G’bari “GQ” Gilliam ʼ16, a hip-hop dancer/choreographer at the height of professional success when a health trauma earlier this year…

Connect Newsletter
Why Not Westwood?

Connect Newsletter